
Swing trading
Best Indicators for Swing Trading: A Practical Guide
The best indicators for swing trading help you make sense of trend, momentum, pullbacks and volatility. Give each tool a clear job, then test the entry, exit and sizing rules together. Every chart example here is hypothetical or clearly identified as a historical illustration.
Quick answer
Use moving averages for trend, RSI for momentum, Fibonacci retracements for reference zones and ATR for volatility-based distances. Start with a small, testable set. None of these tools guarantees an entry or tells you the right personal risk level.
| Tool | Main job |
|---|---|
| Moving averages | Trend direction. |
| RSI | Momentum. |
| Fibonacci retracements | Reference pullback zones. |
| ATR | Volatility-based distances. |
- Define settings and decide when a signal is confirmed.
- Keep swing anchors and test assumptions consistent.
- Include sizing, charges and failed signals in the evaluation.
On this page

How to select the best indicators for swing trading
Choose the market, timeframe and holding period first. A daily-chart swing process has different decision points from a short intraday strategy.
Define whether signals are evaluated on completed candles or while a candle is forming. The distinction affects what information was actually available when a historical trade would have been entered.
Give each indicator one job. A moving average can describe direction, RSI can describe momentum and ATR can scale a volatility-based distance.
Fibonacci levels are a drawing framework rather than an independent measurement of momentum. Combining them should create a coherent decision process, not a vote-counting system that treats every signal as independent evidence.
The MetaTrader 5 indicator guide explains how indicators are applied and configured in the platform. Record your settings, input prices and timeframe before testing. Changing parameters after every losing trade makes it difficult to distinguish a weak idea from an inconsistent evaluation process.
Moving averages: follow the trend
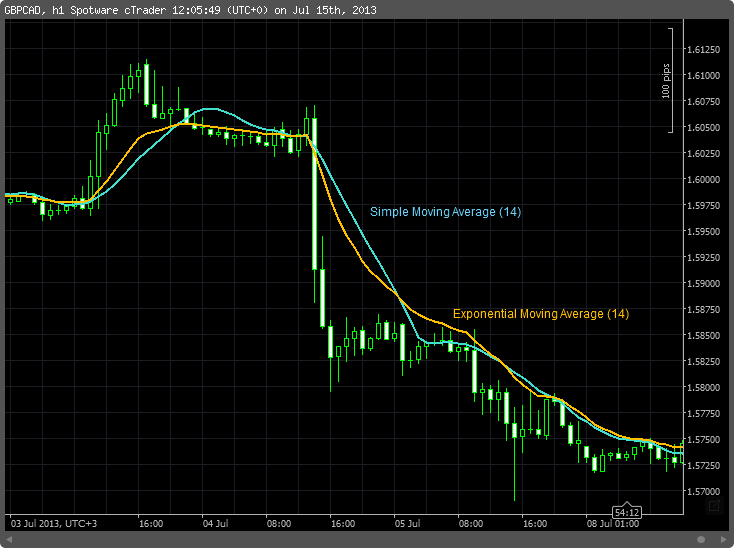
A simple moving average gives equal weight to observations in its window. An exponential moving average gives greater weight to more recent values. Both use past prices and therefore lag. A faster average responds sooner but can generate more changes during sideways movement; a slower one usually reacts later.
For a hypothetical daily-chart rule, classify the environment as upward only when price is above a rising 50-period EMA at the completed close. That is a possible definition, not a recommended universal setting. Write down what “rising” means, such as comparison with the previous completed value, before examining the results.
A crossover can provide an unambiguous event, but it does not solve the lag problem. Repeated crossings in a range can create several small losses and costs.
Evaluate the rule across different conditions, including quiet periods and reversals. Do not judge it only on a chart where a strong trend makes every crossing look obvious.
A useful desk exercise is to hide future candles and mark each qualifying close. Record the next permitted action without moving the entry to a better-looking historical price. This simple discipline helps reveal how different a real-time decision can feel from an annotated chart produced after the trend is complete.
RSI: check momentum
The Relative Strength Index (RSI) compares recent upward and downward price changes to give a momentum reading. The StockCharts RSI reference explains the calculation and interpretation, including why common overbought and oversold labels need context.
A high reading does not require an immediate sell, and a low reading does not require a buy.
Strong trends can sustain extreme readings. If your process trades pullbacks within a trend, an RSI condition might help describe the pullback rather than predict its exact end. Specify the period, level and confirmation rule. “RSI looks stretched” is too flexible to evaluate consistently across a historical sample.
Divergence compares the direction of price extremes with the direction of indicator extremes. For example, price might make a lower low while RSI makes a higher low. That observation can suggest changing momentum, but it does not establish an executable reversal or identify when the market will turn.
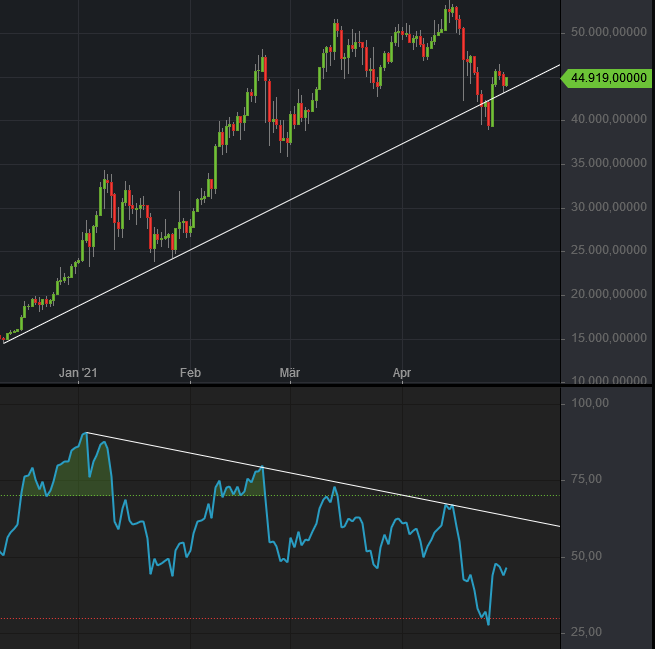

Comparing the best indicators for swing trading starts with a clear rule. With divergence, decide which swings qualify and when they are confirmed. Include the wait in your test; you cannot fairly record an entry at a price you could not yet identify.
Fibonacci: map possible pullback areas
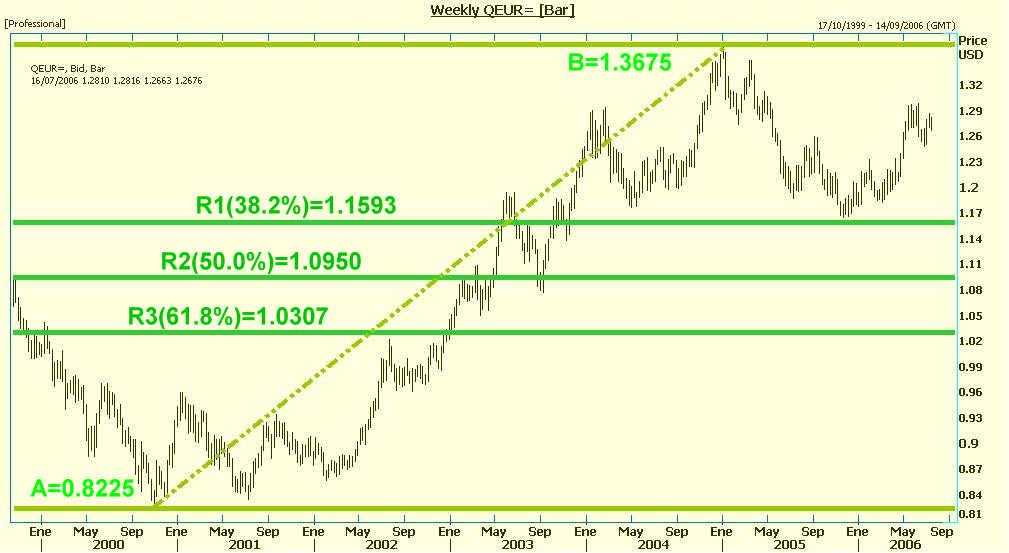
A retracement tool draws reference levels between a selected swing low and swing high, or the reverse. Common levels include 38.2% and 61.8%.
The widely used 50% level is a conventional midpoint, not itself a Fibonacci ratio. The StockCharts Fibonacci retracement guide explains these distinctions and the tool’s charting context.
The main weakness is anchor selection. Two traders can draw different grids on the same chart because they choose different swings.
Before testing, define how a qualifying swing is identified and when the anchors become available. Otherwise, repeatedly redrawing the tool can make past turning points appear more predictable than they were.
Treat a level as an area for observation, not a barrier that price must respect. A hypothetical plan might require a completed-candle condition near a predefined zone, with a separate invalidation point. Include a maximum distance or tolerance so “near” does not expand to accommodate every outcome.
Avoid presenting overlapping Fibonacci levels as independent proof. If all lines come from the same price history and discretionary anchors, their apparent agreement may simply reflect your choices. The useful question is whether the complete rule performs acceptably after costs on data that did not determine its settings.

ATR: measure price movement
Average True Range measures the magnitude of movement, incorporating gaps through its true-range calculation. It does not indicate direction. A rising ATR can accompany either a rally or a decline. Use it to describe changing movement, not as a standalone signal to buy or sell.
If the stop distance doubles while the cash risk budget remains unchanged, the position size generally needs to decrease, assuming the same contract and currency conversion.
Do not keep the original size merely because a wider stop seems more comfortable. Broker minimum volumes may prevent precise sizing in a small account.
ATR-based distances are not guaranteed loss caps. Gaps and execution conditions can produce a worse outcome, and changing volatility can make a previously useful setting inappropriate. Record whether ATR is fixed at entry or updated later; these are different strategies with different behaviour.
Combine the tools into one testable workflow
Start with a trend definition, add a pullback condition, specify an entry trigger and define invalidation. Use volatility to evaluate distance and sizing. You do not need all four tools in every strategy. Removing a redundant condition can make a process easier to test, explain and operate.
Keep a journal containing the information available at the decision time, the intended order and the reason it qualified. Record skipped setups as well as trades. For deeper study, our best swing trading books reading list suggests established texts to compare critically rather than treat as guaranteed systems.
If the account has evaluation restrictions, review common mistakes in funded trading accounts. An indicator setup does not override a daily loss threshold or holding restriction. Account rules and aggregate exposure must remain part of the decision even when the chart looks technically convincing.
Keep a tool only if it helps
Test a simple baseline before adding another indicator. Then compare what changes: the number of qualifying trades, average costs, drawdown and sensitivity to settings.
If an extra condition removes mostly losing trades in the development sample, check whether that effect persists on unseen data rather than declaring the added complexity an improvement.
Frequently asked questions
What is the single best swing trading indicator?
There is no universal winner. Give each tool a job, such as trend or volatility, then test the complete entry, exit and sizing process after realistic costs.
Should I buy whenever RSI falls below 30?
No. RSI can remain low during a strong decline. Define the market context, confirmation, invalidation and size before testing any strategy based on an oversold reading.
Can ATR tell me the correct position size?
ATR can help set a distance, but sizing also needs a cash-risk budget, contract values, conversion and costs. It does not set your personal risk tolerance.
Practise one complete rule on demo
Try the best indicators for swing trading on one demo instrument first. Save the settings, use only information available at the decision time and keep the losing examples. You are looking for a process you can repeat and explain, not a perfect-looking historical chart.
Disclaimer
Educational information, not personal investment advice. Leveraged trading can cause substantial losses. Product availability, provider rules and costs vary by jurisdiction and can change. No affiliate links are used, and no returns or rankings are guaranteed.